Compliance & Audit
ip·Solis bietet einen manipulationssicheren Audit-Trail für jeden Vorgang im System. Jede Mutation — Auftragserstellung, Genehmigung, Runbook-Schritt, Konfigurationsänderung — erzeugt eine ausschließlich anfügbare Audit-Zeile mit vollständiger Zuordnung (wer, mit welchem Credential, mit welcher Rolle). Compliance-Teams können das Audit-Log in der Admin-UI abfragen, exportieren oder in Echtzeit an ein SIEM streamen.
Audit-Log
Die Tabelle audit_log ist die maßgebliche Quelle für alle Systemaktivitäten. Jede Zeile erfasst:
- Entitätstyp und ID — was betroffen war (Auftrag, Asset, Asset-Typ, Genehmigung, Konfigurationsschlüssel usw.)
- Aktion — was geschehen ist (
created,updated,deleted,approved,revoked,password_changed_selfusw.) - Vorher-/Nachher-Werte — ein JSON-Diff der Änderung (Geheimnisse werden niemals aufgenommen)
- Ausgelöst durch — vollständige Zuordnungszeichenkette, die das Credential und die Rolle identifiziert
- Zeitstempel — in UTC gespeichert
Audit-Zuordnung
Jede Audit-Zeile trägt ein Feld triggered_by, das das genaue Credential identifiziert:
| Ausgelöst durch | Bedeutung |
|---|---|
token:<name> |
Benannter API-Token |
admin:session:<user>:<role> |
Admin-Sitzung mit Rolle (z. B. admin:session:alice:superadmin) |
admin:legacy_key |
Veralteter X-Admin-Key-Header |
portal:user:<email> |
Portal-Benutzer (Entra ID SSO) |
portal:anonymous |
Portal mit deaktiviertem SSO |
api:approval_token (approver:<email>) |
Ein-Klick-Genehmigungs-/Ablehnungslink |
system:auto_decline |
Automatisierte Auto-Ablehnungs-Aufgabe |
system:leaver:<source> |
HR-Austrittsprozess |
Das bedeutet, dass Auditoren nicht nur nach dem Wer, sondern auch nach mit welcher Berechtigung filtern können — und so einen Admin, der einen API-Token verwendet, von demselben Admin unterscheiden können, der seine Sitzung nutzt.
Audit-Log-Viewer
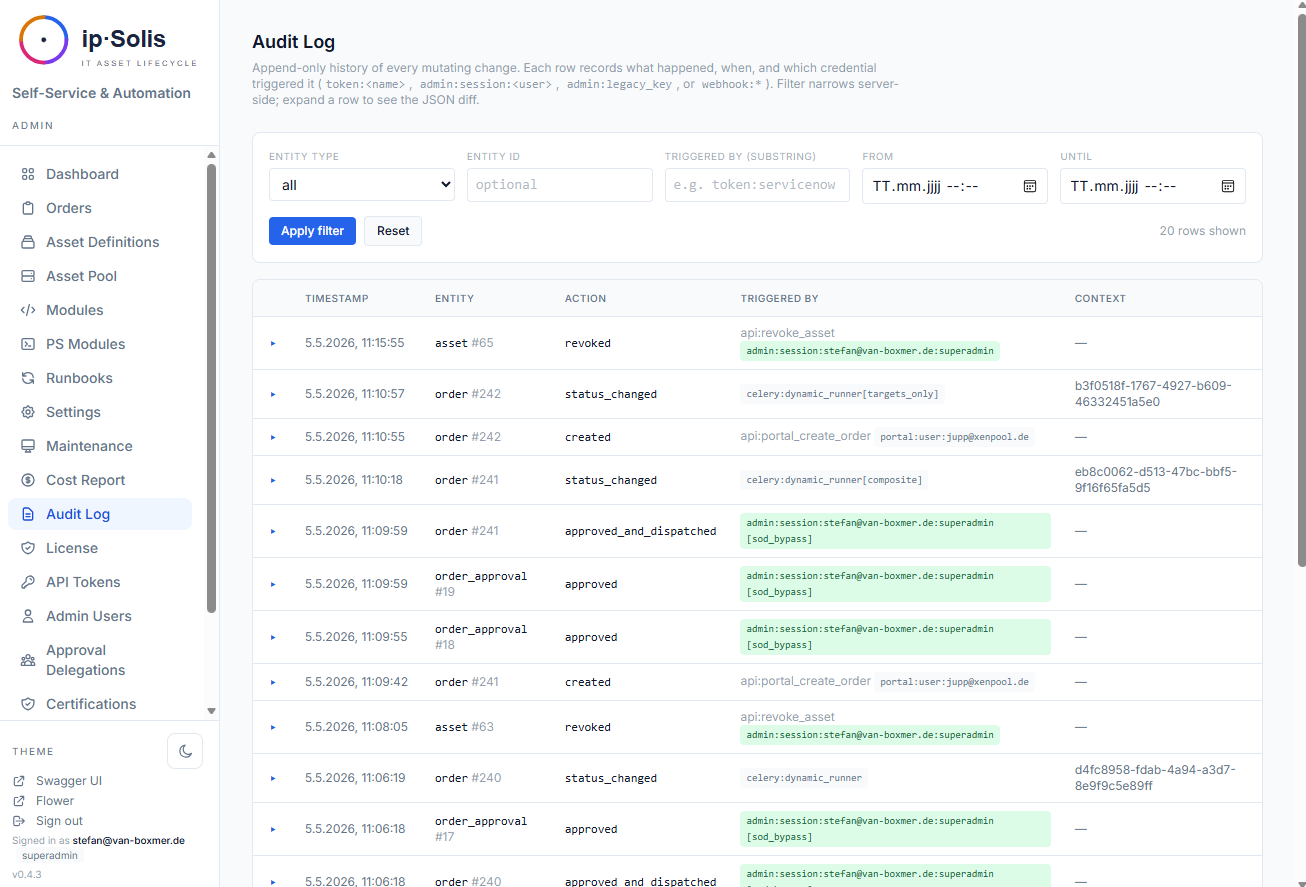
Die Audit-Log-Oberfläche unter Admin → Audit Log bietet:
- Filterung nach Entitätstyp, Entitäts-ID, Teilzeichenkette des Auslösers und Zeitraum
- Farbige Akteur-Badges, die den Credential-Typ auf einen Blick anzeigen (token / session / legacy key / portal / webhook)
- Aufklappbare Zeilen mit dem vollständigen Vorher-/Nachher-JSON-Diff
- CSV-Export
Manipulationsschutz
PostgreSQL-BEFORE-Statement-Trigger auf der Tabelle audit_log blockieren standardmäßig DELETE, UPDATE und TRUNCATE. Der einzige autorisierte Mutationspfad ist die Aufbewahrungs-Bereinigungsaufgabe, die eine dokumentierte sitzungsbezogene Ausnahmeregelung (SET LOCAL ipsolis.allow_audit_mutation = 'true') verwendet, die aus der Anwendungsschicht nicht zugänglich ist.
Auftrags-Änderungsprotokoll
Die Tabelle order_change_log erfasst jede Mutation eines Auftrags als separate Diff-Zeile — getrennt vom Audit-Log, um den Auftragsverlauf einfach navigierbar zu machen, ohne nach Entitätstyp filtern zu müssen. Sichtbar auf der Auftragsdetailseite der Admin-UI.
Zugriffs-Drift-Abgleich *(Pro)*
ip·Solis gewährt AD-Gruppenmitgliedschaft nach dem Fire-and-forget-Prinzip; von sich aus kann es nicht erkennen, ob jemand außerhalb der Reihe (out of band) einer verwalteten Gruppe hinzugefügt oder aus einer entfernt wurde, die es gewährt hat. Die Drift-Abgleich-Aufgabe schließt diese Lücke.
Aktivieren Sie Auf Zugriffs-Drift überwachen pro Asset-Typ und setzen Sie Zeitplan und Modus unter Wartung → Drift-Abgleich. Bei jedem Lauf liest ip·Solis die tatsächliche AD-Mitgliedschaft jeder überwachten Gruppe neu und vergleicht sie mit dem Provisionierten (aus dem Order-Change-Log):
- fehlender Zugriff — ip·Solis hat gewährt, der Benutzer ist aber nicht mehr in der Gruppe
- out-of-band — der Benutzer ist in der Gruppe, ip·Solis hat den Zugriff aber nie gewährt
Befunde erscheinen unter Operations → Drift, werden auditiert (und an Ihr SIEM gestreamt) und können eine Best-Effort-E-Mail-/Teams-Benachrichtigung auslösen. Zwei Modi:
detect_only— erfassen + benachrichtigen (Standard)auto_remediate— fehlende Mitglieder zusätzlich neu gewähren und out-of-band-Mitglieder per AD widerrufen
Attestierungs-Artefakte *(Pro)*
Zwei ISO-27001-relevante Nachweis-Artefakte, beide pro Asset-Typ optional und als signierte HTML-Seiten ausgeliefert (Archivierung per Browser-Druck — keine PDF-Abhängigkeit):
- Übergabeprotokoll — bei der Provisionierung erhält der Empfänger einen signierten Link, um den Erhalt (und eine optionale Nutzungsrichtlinie) zu bestätigen. Die Bestätigung wird persistiert und auditiert. Eine optionale Erinnerung mahnt überfällige Bestätigungen an.
- Widerrufs-/Entsorgungszertifikat — bei Widerruf oder Ablauf eine signierte Bescheinigung darüber, was entfernt wurde (welche Gruppen, welche Instanz, wann) — Audit-Nachweis für Offboarding / Asset-Entsorgung, automatisch ausgestellt.
Der signierte Link funktioniert ohne Portal-Login (derselbe Mechanismus wie der Zertifizierungs-Review-Link) und läuft nach 90 Tagen ab. Ausgestellte Artefakte sehen Sie unter Berichte → Attestierungen; aktivieren Sie die Flags an jeder Asset-Definition und setzen Sie den AUP-Text unter Einstellungen.
Datenklassifizierung auf Feldebene
Attribute von Asset-Typen können mit einer Datenklassifizierung versehen werden:
| Klasse | Bedeutung |
|---|---|
internal |
Routinemäßige Betriebsdaten |
pii |
Personenbezogene Daten |
phi |
Geschützte Gesundheitsdaten |
pci |
Daten der Zahlungskartenindustrie |
Die Klassifizierung wird zum Zeitpunkt der Auftragserstellung in jede Audit-Zeile geschrieben, basierend auf der strengsten Klasse, die auf den Attributen des Asset-Typs deklariert ist. Diese Momentaufnahme ist dauerhaft — selbst wenn die Klassifizierung des Asset-Typs später geändert wird, behalten bestehende Audit-Zeilen die ursprüngliche Klassifizierung bei.
Portal-Warn-Badges — wenn ein Anforderer ein als PII, PHI oder PCI markiertes Attribut ausfüllt, rendert das Portal ein Warn-Badge neben dem Feld, damit ihm die Sensibilität vor dem Absenden bewusst ist.
SIEM-Audit-Log-Streaming *(Pro)*
Jede audit_log-Zeile kann in Echtzeit an ein externes SIEM gestreamt werden. Konfigurieren Sie das SIEM-Backend unter Admin → Settings → SIEM.
Unterstützte Backends:
| Backend | Hinweise |
|---|---|
| Splunk HEC | HTTP Event Collector — standardmäßige Splunk-Token-Authentifizierung |
| Microsoft Sentinel (Legacy) | Azure Monitor Data Collector API — Hinweis: von Microsoft zum 31.08.2026 abgekündigt |
| Microsoft Sentinel (Logs Ingestion API) | DCE/DCR + AAD Service Principal — empfohlen für neue Sentinel-Bereitstellungen |
| Generischer HMAC-Webhook | JSON-POST mit Body-Signierung über X-Hub-Signature-256: sha256=<hex> (GitHub-kompatibel). Konfigurierbarer Header-Name + zusätzliche Header für Datadog, Sumo Logic, Loki, Elastic usw. |
Der Streamer verwaltet einen persistenten Cursor, sodass jede Zeile genau einmal weitergeleitet wird. Vorübergehende Fehler werden automatisch wiederholt. Eine Schaltfläche Send Test Event in der Einstellungs-UI überprüft die Konnektivität, bevor Sie das Streaming aktivieren.
Die Celery-Beat-Aufgabe siem-stream-audit-log läuft jede Minute und leitet alle neuen Zeilen seit der letzten Cursor-Position weiter.
Audit-Aufbewahrungsrichtlinien
Eine tägliche Beat-Aufgabe um 03:00 Uhr bereinigt Audit-Zeilen, die über die konfigurierten Aufbewahrungsfenster hinausgehen. Konfigurieren Sie die Aufbewahrung unter Admin → Settings → Compliance → Retention.
| Konfigurationsschlüssel | Standard | Beschreibung |
|---|---|---|
retention.audit_log_days |
— | Globales Fenster für Zeilen ohne Klassifizierung |
retention.pii_days |
— | Fenster für PII-klassifizierte Zeilen |
retention.phi_days |
— | Fenster für PHI-klassifizierte Zeilen |
retention.pci_days |
— | Fenster für PCI-klassifizierte Zeilen |
Klassifizierungsspezifische Fenster haben Vorrang vor dem globalen Fenster, sodass PII-/PHI-/PCI-Zeilen 7+ Jahre lang aufbewahrt werden können, während routinemäßige Konfigurationsänderungs-Zeilen nach 90 Tagen entfallen.
Die Aufgabe erfasst last_run_at, die Anzahl last_pruned und eine Aufschlüsselung pro Klasse in app_config zur betrieblichen Nachvollziehbarkeit.
Prometheus-Metriken
ip·Solis stellt einen Prometheus-kompatiblen /metrics-Endpunkt bereit mit:
- Anzahl der Anfragen und Latenz-Histogramm pro Route
- Geschäftsbezogene Gauges: Aufträge nach Status, ausstehende Genehmigungen, freie/belegte Pool-Zählungen pro Asset-Typ, Celery-Warteschlangentiefe pro Worker-Queue
Aktivieren mit metrics.enabled = true unter Admin → Settings. Route-Labels verwenden Pfadvorlagen (nicht die tatsächlichen Pfade), um die Kardinalität begrenzt zu halten.
OpenTelemetry-Tracing
Automatisch instrumentierte FastAPI-Anfragen, SQLAlchemy-Abfragen und Celery-Aufgaben erzeugen Spans, die über OTLP HTTP an jeden standardkonformen Collector exportiert werden. Eine Anfrage, die ein Runbook auslöst, erzeugt einen einzigen Trace, der API und Worker umspannt — wodurch es möglich wird, das End-to-End-Timing von der HTTP-Anfrage bis zur Runbook-Fertigstellung zu sehen.
Konfigurieren Sie den Collector-Endpunkt unter Admin → Settings → Observability. Ein Konsolen-Exporter-Modus ist für die lokale Überprüfung ohne laufenden Collector verfügbar.